
In the eCommerce world, Amazon is a platform that has seen immense growth and will probably continue as most of the businesses shifting online. With the change in digital shopping trends, behavior, perspective, algorithm, and other aspects, sellers need to stay updated with the Amazon Statistics. Data is the key, and in order to make appropriate decisions related to their business on Amazon, one must know it inside out. A deep insight into the customer, seller, net revenue, product categories, market share, revenue & other Amazon Statistics that will help to run your business smoothly and boost your sales.
Without further ado, let’s get started with different Amazon Statistics and data to help you understand different areas of Amazon comprehensively.
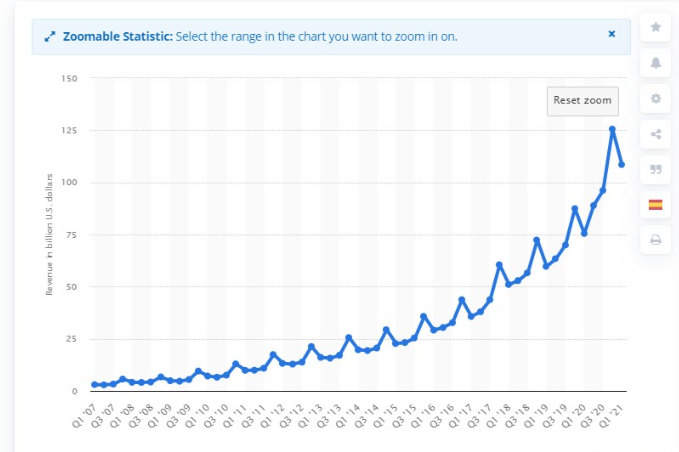
Amazon’s Net Revenue
Amazon saw a lift in the income of 35% in the initial 3/4 of 2020.
During the principal quarter of 2021, Amazon produced total sales of roughly 108.52 billion U.S. dollars. [Source: Statista]
Amazon eCommerce Market Share
Curiously, in Q3 of 2020, Amazon reported an increment in 37% of net deals, hitting $96.1 billion in income.
In the latest years, Amazon has recorded consistent development in net income. To represent, 2016 ($135 billion), 2017 ($177 billion), 2018 ($232 billion), 2019 ($280.52 billion). The net income in 2020 was reported to be 386 billion U.S. dollars. [source: statista 2]
As of July 2020, Amazon’s reasonable worth had reached 1.49 trillion. [source: Forbes 2]
In 2020, Amazon’s extended portion of the retail internet business markets in the U.S. was at 47% and is anticipated to increment to half in 2021. [Source: statista 3]
In 2020, Amazon positioned itself as the top U.S. organization in retail internet business deals, catching 38.7% of the market. By 2021, Amazon is projected to arrive at 39.7% of the overall industry or $302.36 billion in U.S retail online business deals.
Another interesting Amazon Statistics, with regards to Gross Merchandise Volume (GMV) of worldwide online commercial centers, Amazon just positioned third, creating $457 billion in 2020.
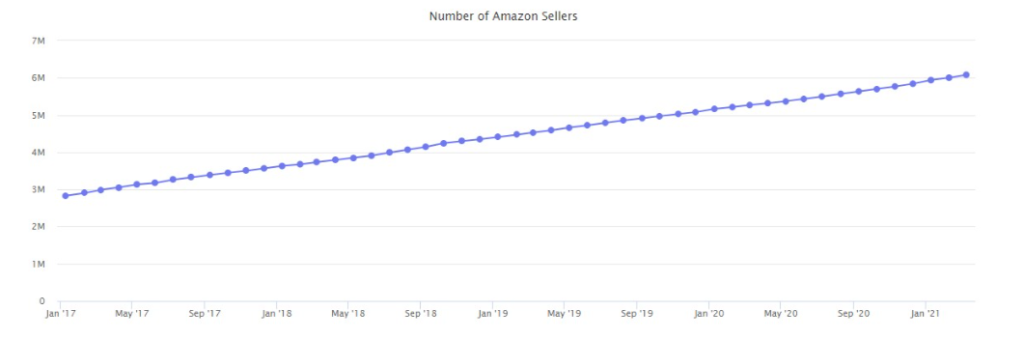
Amazon Seller Statistics-
Amazon marketplace has 6.2 million total sellers around the world.

Amazon consists of 1.5 million active sellers and so far this year 370,000 merchants have joined the Amazon marketplace. At the current rate, 682,000 new merchants will have joined Amazon before the year’s over.
In the primary quarter of 2021, 55 percent of paid units were sold by outsider merchants. [Source: statista 5]
74% of buyers prefer visiting Amazon while making a purchase before searching on any other website.
Strangely, 62% of users believe that cost is their greatest inspiration for choosing an Amazon for shopping. Quality (23%) comes next followed by reviews (12%) and transporting (1%). [Source: FeedVisor]
One interesting amazon seller statistic is that around 92% of Amazon sellers use Fulfillment by Amazon to complete their orders successfully. [Source: JungleScout]
Amazon Customer Statistics
As of January 2021, Amazon positioned 11th in worldwide web traffic engagement.
An incredible 65% of Amazon clients use computers to purchase items. Then again, 26% use cell phones, 9% use tablets, and 1% use voice collaborators. As far as rate, 48% of U.S. shoppers visit Amazon something like a couple of times each week. Then again, an incredible 89% of U.S. purchasers visit Amazon basically once every month [Source: FeedVisor]
63% of buyers start their quest for product research on Amazon. Then again, 63% looked at costs on Walmart, half found new items or brands on Google, and half looked for motivation on Instagram. [Source: Catalystdigital]
With regards to checking reviews, 79% of U.S. purchasers go to Amazon. [Source: FeedVisor]
Nearly half of the Americans typically begin searching for products on Amazon when shopping on the web.
All the more critically, prior to making a buy, 82% of shoppers check costs from Amazon While making a purchase, 45% of U.S. shoppers often go through the product suggestion page. Curiously, 26% of shoppers purchase the principal item to show up on the Amazon indexed lists page.
43% of U.S. buyers click on Amazon ads from the web Of those that click on an Amazon advertisement on the web, Google contributes 76%, Facebook (49%), Instagram (21%), Twitter (14%), Pinterest (12%), and Snapchat (7%). [Source: FeedVisor]
Amazon Prime Membership Statistics
Let’s break down some of the important Amazon Statistics on Prime Membership.
In the primary quarter of 2021, Amazon received 200 million paying Prime members around the world.
Amazon insights show that in Q3 2020 alone, the firm acquired $6.58 billion from the subscription services.
In the first quarter of 2021,126 million users bought into the Amazon Prime service in the United States. [Source: statista 7]
The data estimation shows that by the end of 2022, there will be 153.1 million US Amazon Prime users, up from 142.5 million users in 2020. [Source: emarketer.com 1]
Likewise, 93% of Amazon Prime individuals reestablish their enrollment following one year. [Source: digitalcommerce360]
An expected 82% of families in the U.S. had Amazon Prime in 2019. This number doesn’t factor in families with multiple Prime enrollments. While in 2020, 71.3 million U.S. families had an Amazon Prime membership.
The number is projected to increase to 76.6 million families by 2022. [Source: emarketer.com 2]
Even better, 55% of U.S. buyers are current Amazon Prime individuals, while 15% are previous Prime individuals. 48% of Amazon Prime supporters purchase items online all the more regularly or after seven days. From one viewpoint, 74% purchase an item online essentially at regular intervals.
Additionally, as indicated by Amazon Prime individuals measurements, coming up next are the most loved Prime membership benefits. Free two-day dispatching (83%), video and music web-based (10%), PrimeExclusive arrangements at Whole Foods (5%), free book recordings and magazines (1%), and others (1%). [Source: FeedVisor]
Additionally, Statista uncovered one important Amazon prime membership statistics that by and large, an Amazon Prime Member burns through $1400 on eCommerce shopping, contrasted with $600 expenditure of non-Prime individuals.
34% of current Prime individuals consistently purchase Prime-qualified items, while 53% every now and again purchase Prime-qualified items. [Source: FeedVisor]
Amazon Prime Day Statistics
In 2020, Amazon Prime Day deals added up to an expected 10.4 billion U.S. dollars. In 2019, outsider merchants represented around 35 percent of Amazon Prime Day deals. [Source: statista]
Prime Day 2020 deals enrolled a record of $3.5 billion, which surpassed 2019 deals by around 60%. On the primary day of Prime Day, Amazon saw a lift of 700% in units sold.
According to one Amazon Prime day statistics, more than $10.4 billion worth of items were sold on Amazon Prime Day in 2020. 62% of customers purchased occasion endowments on Prime Day 2020. [Source: digitalcommerce360.com]
During the final quarter of 2020, 67% of individuals wanted to make a buy on Amazon Prime Day. [Source: retailmenot.mediaroom.com]
In the U.S., electronics was the most bought item class on Amazon Prime Day at 32%, trailed by family fundamentals (22%), wellbeing and excellence (21%), and toys and computer games (21%).
The small and medium-sized businesses broke the record of sales with a revenue of $3.5 billion.
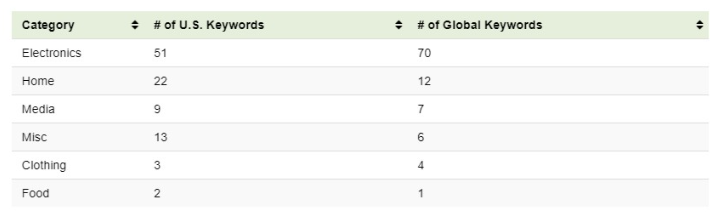
Statistics of Amazon Product Categories
Amazon has an inventory of 12 million items across all classes and administrations.
Calculating in the Amazon Marketplace, there are 350 million items accessible on Amazon. [Source: repricerexpress.com]
Amazon product categories with the most global keywords are electronics (70) trailed by home (12), media (7), others (6), clothing (4), and food (1).
Getting down amazon product selling statistics to the better subtleties, gadgets (44%) are the most often purchased item on Amazon. Others in the rundown include: clothing, shoes & jewelry (43%), Home & Kitchen (39%), beauty & personal care (36%), books (33%), cell phones & accessories (28%), movie & TV (25%), pet supplies (20%), sport & outdoors (17%), grocery & gourmet food (15%), automotive parts & accessories (13%), and baby products (9%).
Likewise, Amazon has a huge piece of the pie across various classes. The classes incorporate electronics (89.9%), home improvement (83.8%), food (81.8%), sports, fitness & outdoors (89.6%), household essentials (88.8%), and health/medicines (92%). [Source: FeedVisor]
The top item class for Amazon dealers is home and kitchen, which represents 40% of items recorded on the website.
Wrapping Up
For new sellers, it can be a little challenging to run their business seamlessly on Amazon. But once you get the drill, there’s no turning back. Amazon is a huge marketplace, and it can be a game-changing opportunity if you implement the right strategies, understand the key areas and opportunities effectively. The above-mentioned stats is all about providing insights into the world of Amazon.
If you are new on Amazon but do not have set marketing strategies to promote your product, we are here to help. At SunTecIndia.net, we offer a broad range of marketing services for Amazon sellers, right from product listing optimization to PPC management. Our team of Amazon specialists cater to every product category and fabricate an effective plan of action to elevate the product rankings on Amazon’s search engine. To hire an Amazon expert, give us a call at +1 585 283 0055, +44 203 514 260, or write to us at info@suntecindia.net